Average & Median Sales Price
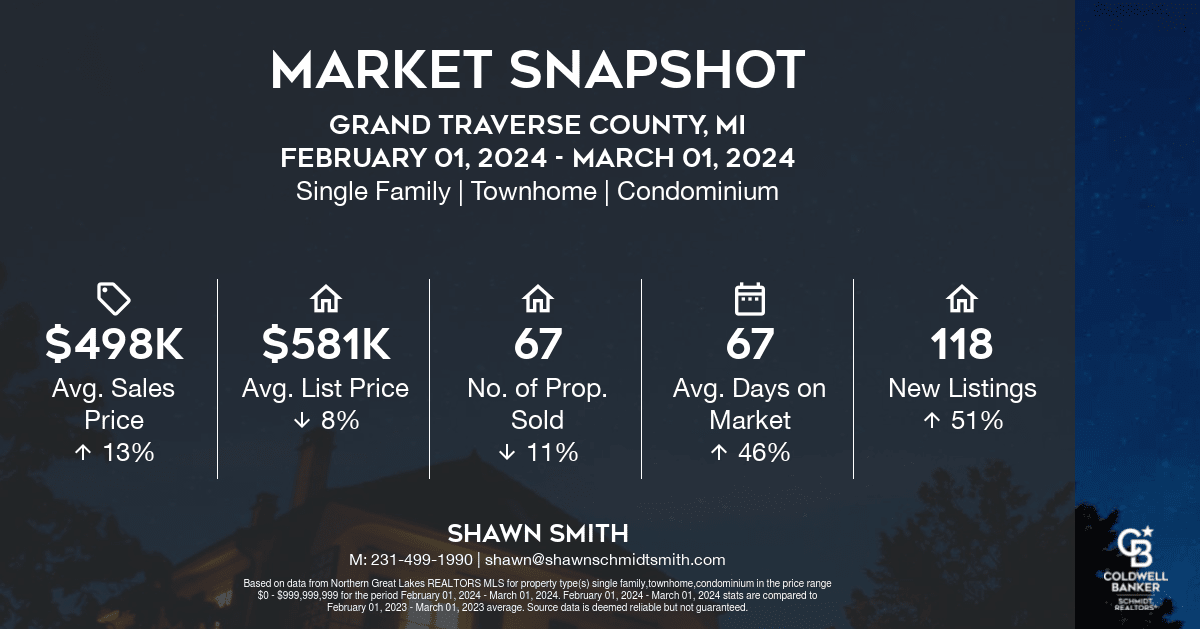
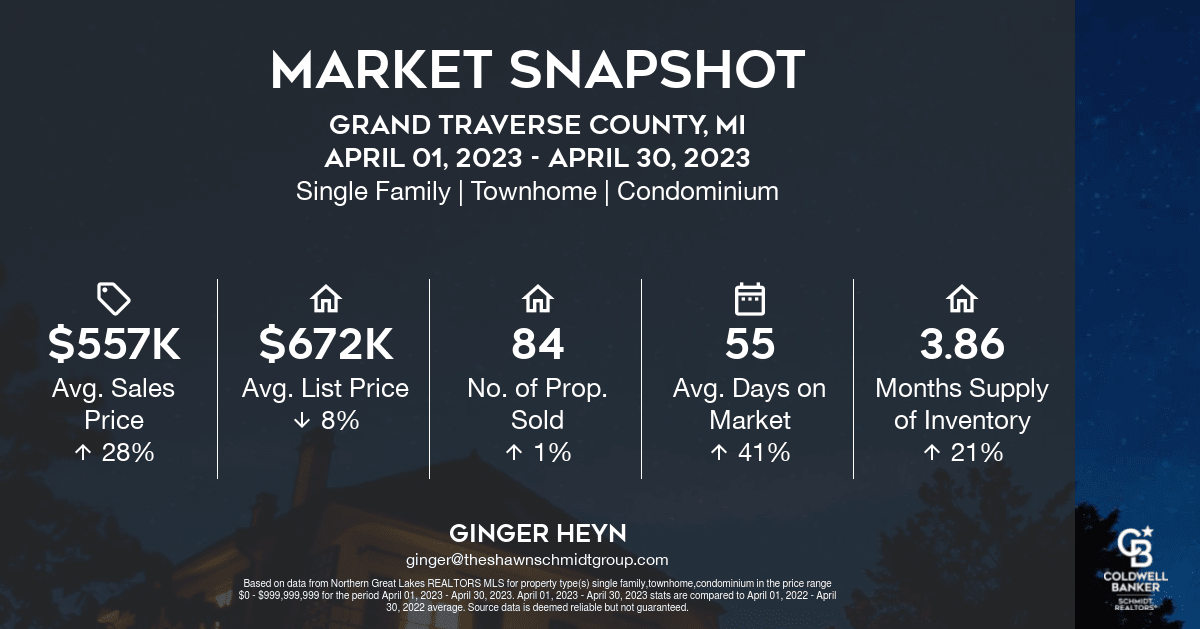
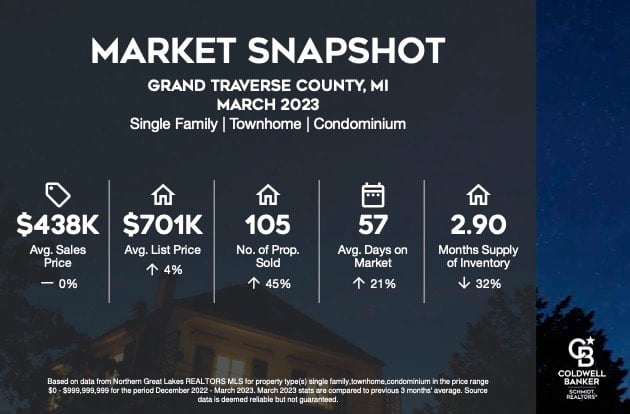
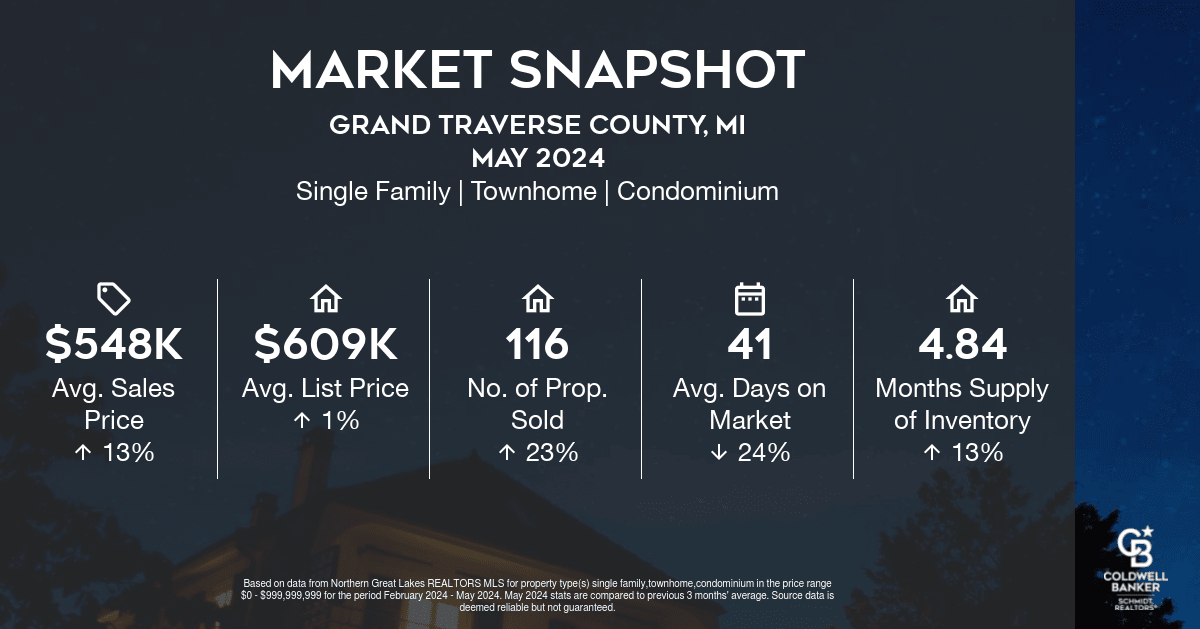
The median sales price in May 2024 was $434,735, up 13.29% from $383,750 from the previous month and 7.53% higher than $404,275 from May 2023. The May 2024 median sales price was at its highest level compared to May 2023 and 2022. The average sales price in May 2024 was $548,261, up 9.57% from $500,389 from the previous month and 12.44% higher than $487,597 from May 2023. The May 2024 average sale price was at its highest level compared to May 2023 and 2022.
Sales Price / List Price Ratio
The sales price/list price ratio is the average sale price divided by the average list price for sold properties expressed as a percentage. If it is above 100%, homes are selling for more than the list price. If it is less than 100%, homes are selling for less than the list price.The May 2024 sales price/list price ratio was 99.89%, equal to the previous month and equal to May 2023.
Number of Properties Sold & Absorption Rate
The number of properties sold in May 2024 was 116, up 9.43% from 106 from the previous month and -13.43% lower than 134 from May 2023. The May 2024 sales were at its lowest level compared to May 2023 and 2022. Absorption rate is the avg number of sales per month divided by the total number of available properties.
Average Days on Market
The average days on market (DOM) is the number of days a property is on the market before it sells. An upward trend in DOM tends to indicate a move towards a buyer's market, a downward trend tends to indicate a move towards seller's market. The DOM for May 2024 was 41 days, down -4.65% from 43 days from the previous month and 5.13% higher than 39 days from May 2023. The May 2024 DOM was at its highest level compared with May 2023 and 2022.
Average Sales Price per Square Foot
The average sales price per square foot is a more normalized indicator for the direction of property value. The sales price per square foot in May 2024 was $292, up 2.10% from $286 from the previous month and 6.18% higher than $275 from May 2023.
Inventory & MSI
The number of properties for sale in May 2024 was 562, up 25.17% from 449 from the previous month and 68.77% higher than 333 from May 2023. The May 2024 inventory was at its highest level compared with May 2023 and 2022. A comparatively lower MSI is more beneficial for sellers while a higher MSI is better for buyers. The May 2024 MSI of 4.84 months was at its highest level compared with May 2023 and 2022.
New Listings
The number of new listings in May 2024 was 237, up 10.75% from 214 from the previous month and 20.92% higher than 196 from May 2023. The May 2024 listings were at its highest level compared to May 2023 and 2022.
CLICK HERE to view graphs for these stats.
© 2024 Coldwell Banker. All Rights Reserved. Coldwell Banker and the Coldwell Banker logos are trademarks of Coldwell Banker Real Estate LLC. The Coldwell Banker® System is comprised of company owned offices which are owned by a subsidiary of Realogy Brokerage Group LLC and franchised offices which are independently owned and operated. The Coldwell Banker System fully supports the principles of the Fair Housing Act and the Equal Opportunity Act.